


| SEARCH |
-

Nov 17, 2015
Reflections on a three-decade legacy
The International Geosphere-Biosphere Programme (IGBP) will come to a close at t...
-
Nov 17, 2015
Use of and access to content on this website
Text and images produced by IGBP in house are free to use with appropriate credi...
-
Nov 12, 2015
Bella Gaia performance and panel discussion to mark IGBP's closure
A musical performance by Bella Gaia will celebrate the achievements and legacy o...
-

Towards Future Earth:
evolution or revolution?
During its three decades of existence, the International Geosphere-Biosphere Pro...
-
A personal note on IGBP and the social sciences
Humans are an integral component of the Earth system as conceptualised by IGBP. João Morais recalls key milestones in IGBP’s engagement with the social sciences and offers some words of advice for Future Earth.
-
IGBP and Earth observation:
a co-evolution
The iconic images of Earth beamed back by the earliest spacecraft helped to galvanise interest in our planet’s environment. The subsequent evolution and development of satellites for Earth observation has been intricately linked with that of IGBP and other global-change research programmes, write Jack Kaye and Cat Downy .
-
Deltas at risk
Around 500 million people worldwide live on deltas, but many of the world's deltas are sinking due ...
-
Climate change: the state of the science
A new data visualization released on the first day of the plenary negotiations at the UNFCCC’s clima...
-
Climate Change:
the State of the Science
Videos now online from the Stockholm public forum to mark the launch of the IPCC's climate report, 2...

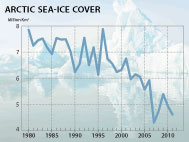
2011 Climate Change Index
How is the index calculated?
The reference point is 1980 - the earliest date the index has been calculated. The annual change of each parameter (carbon dioxide, sea level, temperature, Arctic sea-ice minimum) is normalised (between 1980 and 2007). Zero is no annual change. One hundred is the maximum-recorded annual change between 1980 and 2007. Minus one hundred is the minimum change between 1980 and 2007.
Each year, we take the average of the normalised parameters. This gives the index for the year. The value of the index for each year is added to that of the previous year to show the cumulative effect of annual change.
The Climate Change Index is in development and subject to review.


ftp://ftp.cmdl.noaa.gov/ccg/co2/trends/co2_annmean_mlo.txt
Reference: Dr. Pieter Tans, NOAA/ESRL (www.esrl.noaa.gov/gmd/ccgg/trends/) and Dr. Ralph Keeling, Scripps Institution of Oceanography (scrippsco2.ucsd.edu/)


ftp://sidads.colorado.edu/DATASETS/NOAA/G02135/Sep/N_09_area.txt

Climate-change index from 1980, including cumulative change
| Global land surface temp. anomaly | Atmos. CO2 | N. hemis. minimum sea ice extent | Sea level | Climate Index | Climate Index Cumulative | |
|---|---|---|---|---|---|---|
| Year | Degrees C | ppm | mill km2 | mm | ||
| 1980 | 14.30 | 338.68 | 7.85 | 142.20 | 28 | 28 |
| 1981 | 14.39 | 340.10 | 7.25 | 154.60 | 49 | 77 |
| 1982 | 14.09 | 341.44 | 7.45 | 148.90 | -21 | 56 |
| 1983 | 14.34 | 343.03 | 7.52 | 157.30 | 44 | 100 |
| 1984 | 14.16 | 344.58 | 7.17 | 156.30 | 4 | 104 |
| 1985 | 14.14 | 346.04 | 6.93 | 146.00 | -6 | 98 |
| 1986 | 14.20 | 347.39 | 7.54 | 146.70 | 9 | 107 |
| 1987 | 14.35 | 349.16 | 7.48 | 147.30 | 26 | 133 |
| 1988 | 14.43 | 351.56 | 7.49 | 152.00 | 34 | 167 |
| 1989 | 14.31 | 353.07 | 7.04 | 156.40 | 19 | 186 |
| 1990 | 14.46 | 354.35 | 6.24 | 157.80 | 33 | 219 |
| 1991 | 14.45 | 355.57 | 6.55 | 160.90 | 12 | 230 |
| 1992 | 14.17 | 356.38 | 7.55 | 163.70 | -18 | 212 |
| 1993 | 14.2 | 357.07 | 6.50 | 159.33 | 12 | 225 |
| 1994 | 14.32 | 358.82 | 7.18 | 163.18 | 21 | 246 |
| 1995 | 14.51 | 360.80 | 6.13 | 168.76 | 52 | 298 |
| 1996 | 14.43 | 362.59 | 7.88 | 169.86 | -10 | 288 |
| 1997 | 14.47 | 363.71 | 6.74 | 175.45 | 37 | 325 |
| 1998 | 14.77 | 366.65 | 6.56 | 177.75 | 50 | 375 |
| 1999 | 14.51 | 368.33 | 6.24 | 178.38 | 3 | 378 |
| 2000 | 14.50 | 369.52 | 6.32 | 180.73 | 13 | 391 |
| 2001 | 14.60 | 371.13 | 6.75 | 186.91 | 26 | 417 |
| 2002 | 14.71 | 373.22 | 5.96 | 190.83 | 42 | 459 |
| 2003 | 14.70 | 375.77 | 6.15 | 193.39 | 23 | 482 |
| 2004 | 14.63 | 377.49 | 6.05 | 196.85 | 18 | 500 |
| 2005 | 14.80 | 379.80 | 5.57 | 201.61 | 45 | 545 |
| 2006 | 14.70 | 381.90 | 5.92 | 203.34 | 10 | 555 |
| 2007 | 14.78 | 383.77 | 4.30 | 203.71 | 42 | 596 |
| 2008 | 14.57 | 385.59 | 4.73 | 208.37 | 6 | 602 |
| 2009 | 14.72 | 387.38 | 5.39 | 212.42 | 24 | 626 |
| 2010 | 14.86 | 389.78 | 4.93 | 213.75 | 37 | 663 |
| 2011 | 14.72 | 391.57 | 4.61 | 215.00 | 10 | 672 |
Data
Global Temperature Anomaly
Data - NASA Goddard Institute for Space Studies
http://data.giss.nasa.gov/gistemp/tabledata/GLB.Ts.txt
(Downloaded 25 January 2012)
Carbon dioxide
Data Carbon Dioxide Information Analysis Center (CDIAC)
ftp://ftp.cmdl.noaa.gov/ccg/co2/trends/co2_annmean_mlo.txt
Ref: Dr. Pieter Tans, NOAA/ESRL (www.esrl.noaa.gov/gmd/ccgg/trends/) and Dr. Ralph Keeling, Scripps Institution of Oceanography (scrippsco2.ucsd.edu/)
(Downloaded 25 January 2012)
Sea level
Data - Church and White Global Mean Sea Level Reconstruction
Proudman Oceanographic Laboratory
http://www.cmar.csiro.au/sealevel/sl_data_cmar.html
(Downloaded 23 February 2012)
Sea ice (Arctic minimum)
Data - National Snow and Ice Center (Boulder Colorado)
ftp://sidads.colorado.edu/DATASETS/NOAA/G02135/Sep/N_09_area.txt
(Downloaded 25 January 2012)
Two-minute film about the index
Watch a short film that explains the index.


IGBP closed at the end of 2015. This website is no longer updated.
-

Global Change Magazine No. 84
This final issue of the magazine takes stock of IGBP’s scientific and institutional accomplishments as well as its contributions to policy and capacity building. It features interviews of several past...
-

Global Change Magazine No. 83
This issue features a special section on carbon. You can read about peak greenhouse-gas emissions in China, the mitigation of black carbon emissions and the effect of the 2010-2011 La Niña event on gl...
-
INTERGOVERNMENTAL PANEL ON CLIMATE CHANGE:
How green is my future?
UN panel foresees big growth in renewable energy, but policies will dictate just how big.
-
UK:
'The Anthropocene: a new epoch of geological time?'
Royal Society, Philosphical Transactions A