


| SEARCH |
-

Nov 17, 2015
Reflections on a three-decade legacy
The International Geosphere-Biosphere Programme (IGBP) will come to a close at t...
-
Nov 17, 2015
Use of and access to content on this website
Text and images produced by IGBP in house are free to use with appropriate credi...
-
Nov 12, 2015
Bella Gaia performance and panel discussion to mark IGBP's closure
A musical performance by Bella Gaia will celebrate the achievements and legacy o...
-

Towards Future Earth:
evolution or revolution?
During its three decades of existence, the International Geosphere-Biosphere Pro...
-
A personal note on IGBP and the social sciences
Humans are an integral component of the Earth system as conceptualised by IGBP. João Morais recalls key milestones in IGBP’s engagement with the social sciences and offers some words of advice for Future Earth.
-
IGBP and Earth observation:
a co-evolution
The iconic images of Earth beamed back by the earliest spacecraft helped to galvanise interest in our planet’s environment. The subsequent evolution and development of satellites for Earth observation has been intricately linked with that of IGBP and other global-change research programmes, write Jack Kaye and Cat Downy .
-
Deltas at risk
Around 500 million people worldwide live on deltas, but many of the world's deltas are sinking due ...
-
Climate change: the state of the science
A new data visualization released on the first day of the plenary negotiations at the UNFCCC’s clima...
-
Climate Change:
the State of the Science
Videos now online from the Stockholm public forum to mark the launch of the IPCC's climate report, 2...

Climate change in a nutshell
Economic indices like the Dow Jones are extremely powerful communications tools. The single number, distilled from perhaps hundreds of sources, combines a wealth of underlying information. The underlying data are essential to professionals in the field, but they are an unnecessary distraction to most others. The media stops at the index, only delving deeper when the markets crash or soar: most people are not interested in the detail.
Economic theorists argue how inaccurate these economic indices are for predicting economic trends, but nevertheless the press, the public, policymakers and economists follow them daily. They are easy to digest, and give a simple thumbs up/thumbs down assessment of economic trends.


The idea came about when several IGBP scientists, including Steven Running, former IGBP director Kevin Noone, Kathy Hibbard, Mark Stafford Smith, IGBP executive director Sybil Seitzinger, Peter Cox, Suzi Kerr and Pierre Friedlingsten, realised that the way various global datasets are reported throughout the year is confusing. It is uncoordinated, there is a variety of unfamiliar units, and natural variability sometimes masks a trend. The press and public are not clear about the scale of the changes scientists are witnessing. The index is a response to these concerns.
Why those four metrics? Steven Running from the University of Montana says, "The iconic Mauna Loa atmospheric CO2 concentration was obvious. Global air temperature is already widely reported at the end of each calendar year, so that was a logical choice too.

In the future, other variables could be added. "We did not identify any good land surface variable, because no good standard exists," says Running. "But some day we may have annual albedo or land-cover change."

Number crunching
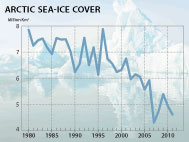
The index displays yearly change. So even though sea ice is reducing and the other parameters are increasing the index shows that every year, we are moving rapidly away from a nominal 1980 date.
Each parameter is normalised between -100 and +100. Zero is no annual change. One hundred is the maximum-recorded annual change since 1980. We then took the average of the four normalised parameters. This gives the index for the year. The value for each year is added to that of the previous year because this is the cumulative change.
Running says, "Some of us thought we’d need a five-year rolling average to help dampen fluctuations and to elucidate core trends. But when we first produced the index it was obvious this was unnecessary: the index removes natural variability extremely effectively." The index shows that, since 1980, there has been a steady upward trend. The index decreased in value for just three years in the 30-year period: 1982, 1992 and 1996.
There is growing international interest in the index. IGBP will publish it annually and promote it to policymakers, government departments, the public, the media, organisations such as WWF and schools. It will be available on the IGBP home page and as a PowerPoint slide, and we will ensure easy access to the underlying data.
Requests have also come in to backdate the index 100 years, maybe even 1000 years or more. Probably the first development, though, will be an index on extreme events.
Written by Owen Gaffney
IGBP Director of Communcations
December 2015. Correction: the article has been modified slightly. The index does not show an increasing rate of change as previously indicated. It shows an upward trend.


IGBP closed at the end of 2015. This website is no longer updated.
-

Global Change Magazine No. 84
This final issue of the magazine takes stock of IGBP’s scientific and institutional accomplishments as well as its contributions to policy and capacity building. It features interviews of several past...
-

Global Change Magazine No. 83
This issue features a special section on carbon. You can read about peak greenhouse-gas emissions in China, the mitigation of black carbon emissions and the effect of the 2010-2011 La Niña event on gl...
-
INTERGOVERNMENTAL PANEL ON CLIMATE CHANGE:
How green is my future?
UN panel foresees big growth in renewable energy, but policies will dictate just how big.
-
UK:
'The Anthropocene: a new epoch of geological time?'
Royal Society, Philosphical Transactions A