


| SEARCH |
-

Nov 17, 2015
Reflections on a three-decade legacy
The International Geosphere-Biosphere Programme (IGBP) will come to a close at t...
-
Nov 17, 2015
Use of and access to content on this website
Text and images produced by IGBP in house are free to use with appropriate credi...
-
Nov 12, 2015
Bella Gaia performance and panel discussion to mark IGBP's closure
A musical performance by Bella Gaia will celebrate the achievements and legacy o...
-

Towards Future Earth:
evolution or revolution?
During its three decades of existence, the International Geosphere-Biosphere Pro...
-
A personal note on IGBP and the social sciences
Humans are an integral component of the Earth system as conceptualised by IGBP. João Morais recalls key milestones in IGBP’s engagement with the social sciences and offers some words of advice for Future Earth.
-
IGBP and Earth observation:
a co-evolution
The iconic images of Earth beamed back by the earliest spacecraft helped to galvanise interest in our planet’s environment. The subsequent evolution and development of satellites for Earth observation has been intricately linked with that of IGBP and other global-change research programmes, write Jack Kaye and Cat Downy .
-
Deltas at risk
Around 500 million people worldwide live on deltas, but many of the world's deltas are sinking due ...
-
Climate change: the state of the science
A new data visualization released on the first day of the plenary negotiations at the UNFCCC’s clima...
-
Climate Change:
the State of the Science
Videos now online from the Stockholm public forum to mark the launch of the IPCC's climate report, 2...

Ocean Acidification Summary for Policymakers 2013
This summary for policymakers reports on the state of scientific knowledge on ocean acidification, based on the latest research presented at The Third Symposium on the Ocean in a High-CO2 World, held in Monterey, California, in September 2012. Experts present the projected changes from ocean acidification for ecosystems and the people who rely on them, according to levels of confidence for these outcomes.
Ocean Acidification Summary for Policymakers
Third Symposium on the Ocean in a High-CO2 World
Download the full English language pdf. (pdf, 4.9 MB)
Download the German language version of the Summary (pdf, 6.3 MB).
Download the Spanish language version of the Summary. (pdf, 7.2 MB)
Download the French language version of the Summary (pdf, 7.7 MB)
.........................................
Download the summary here, as well as the infographics that illustrate the problems that ecosystems and humans face as ocean acidification increases over the next century. The summary addresses outcomes based on whether humans continue to emit carbon dioxide at current rates to the atmosphere, or what could happen if policymakers take action to mitigate these emissions.

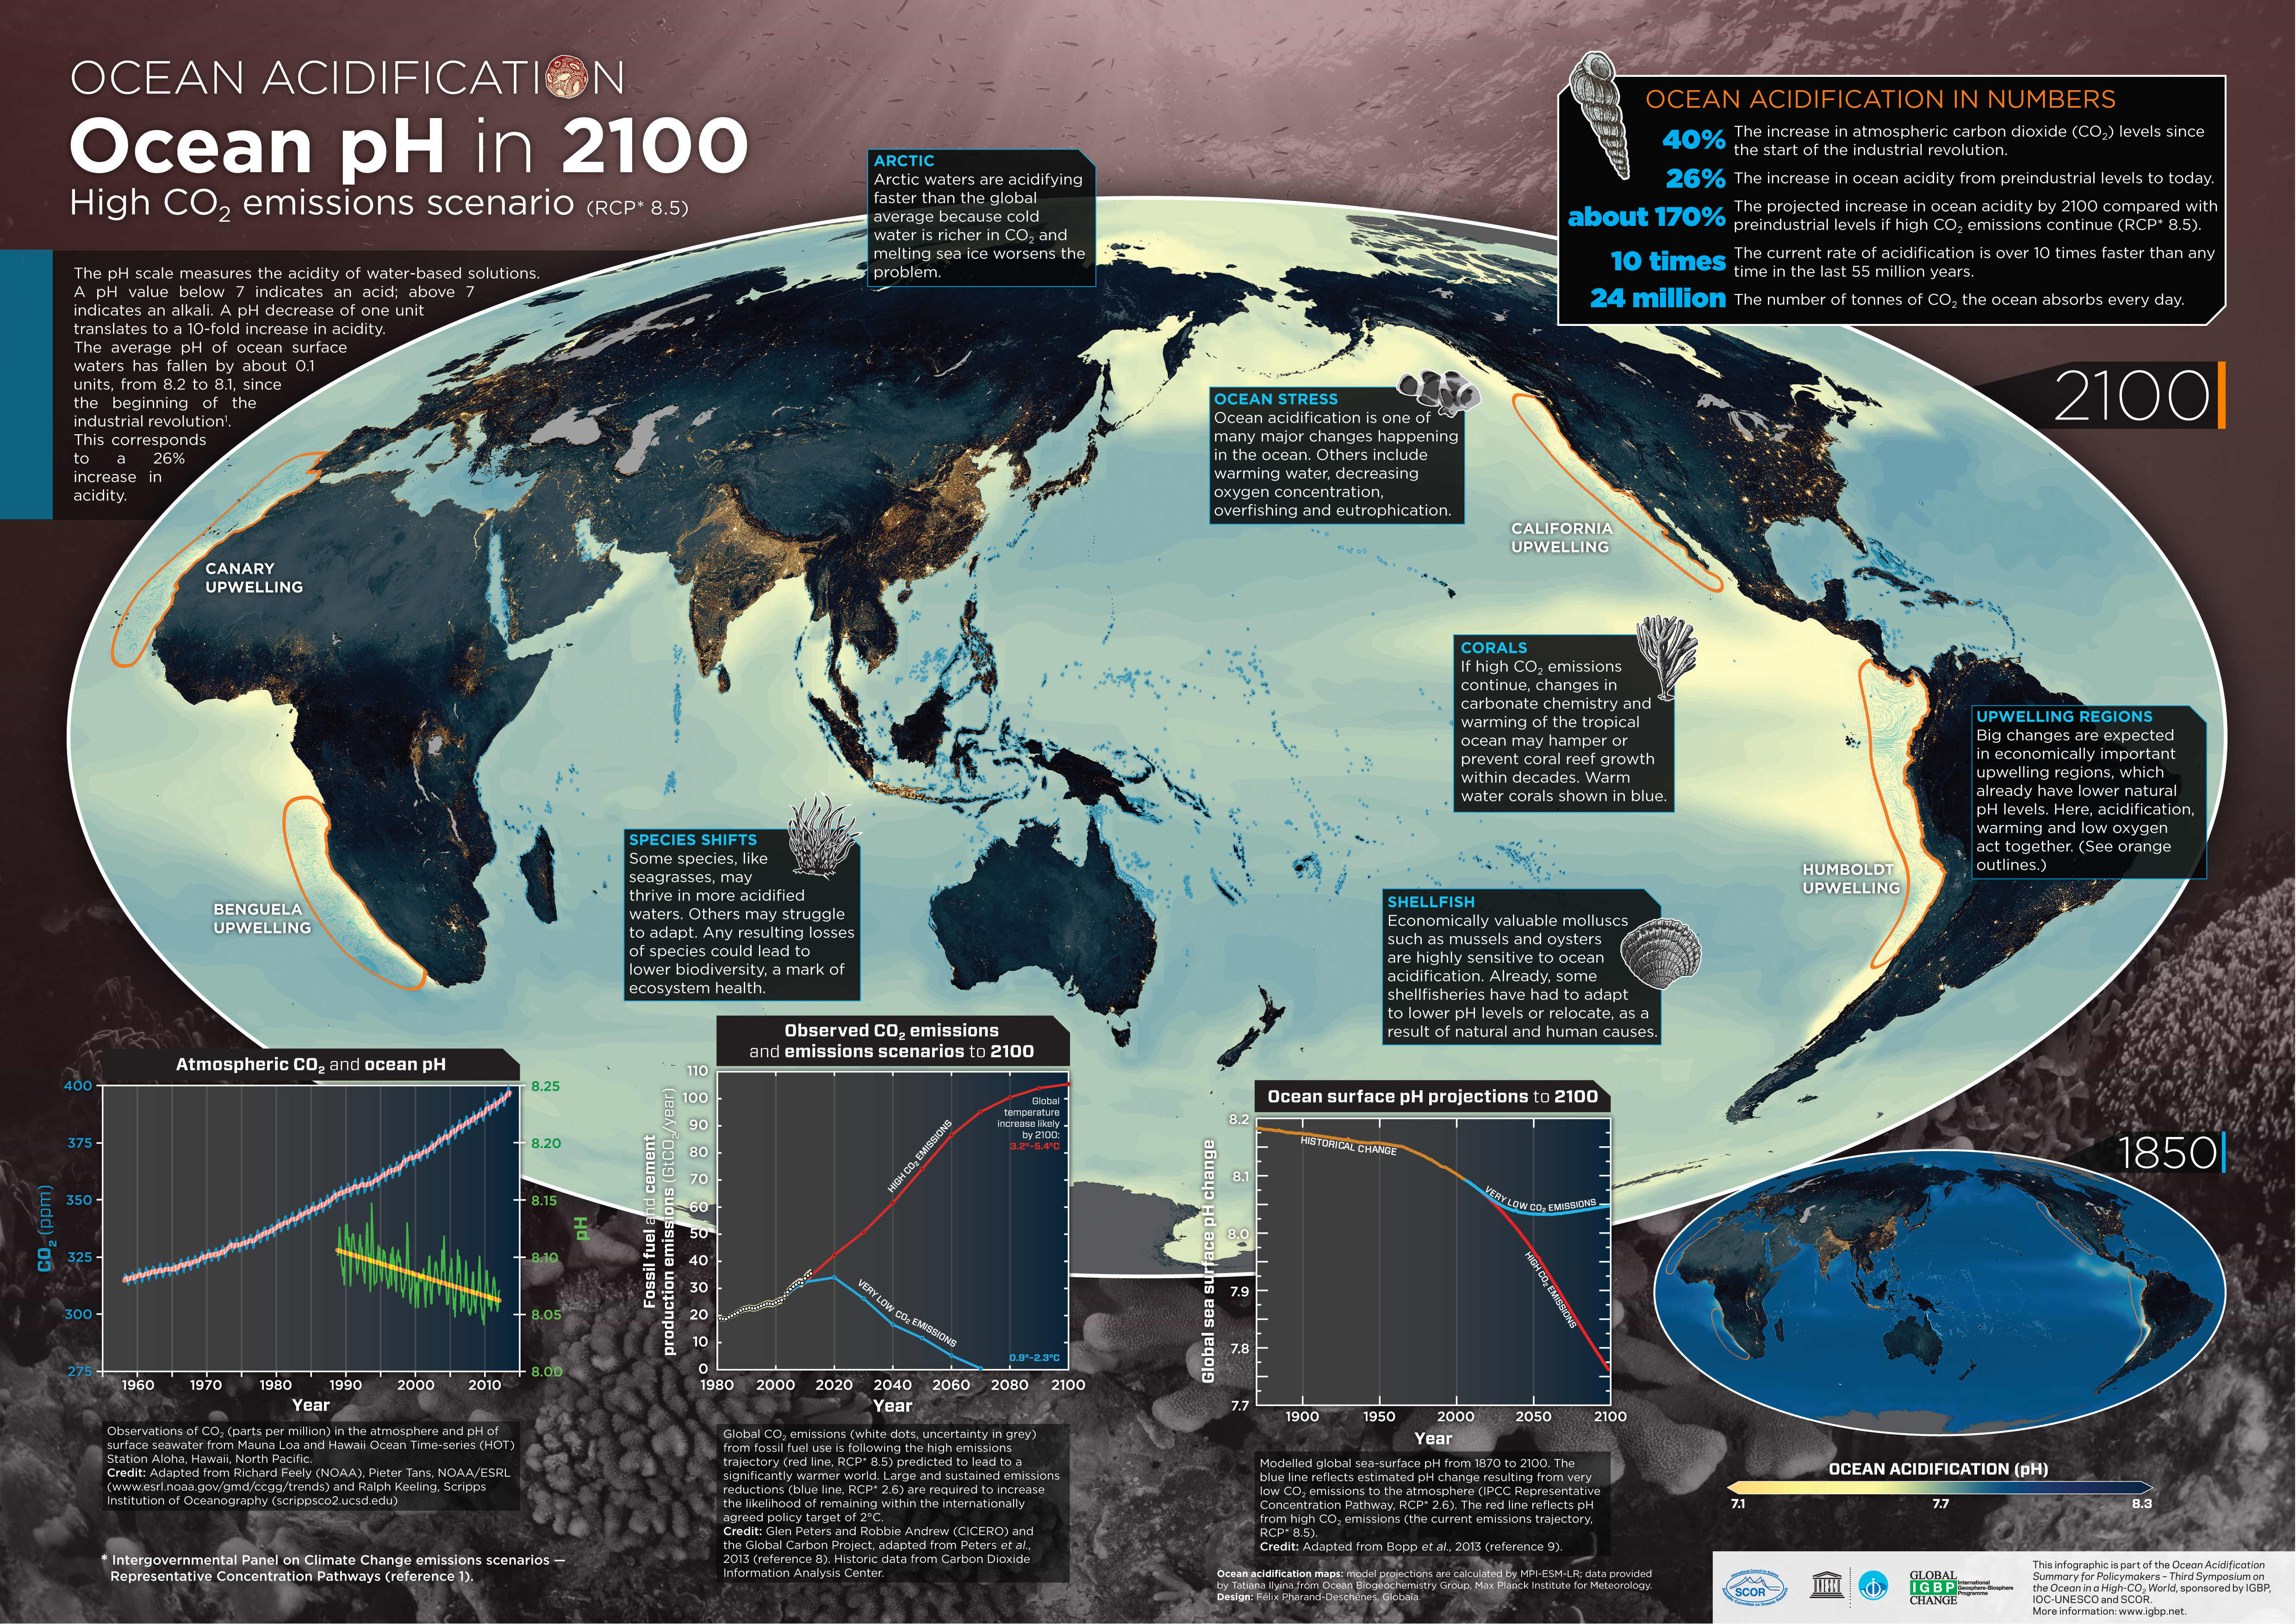
Ocean pH in 2100

The average pH of ocean surface waters has fallen by about 0.1 units, from 8.2 to 8.1, since the beginning of the industrial revolution. This corresponds to a 26% increase in acidity. Please see original infographic for sources and further information.
Ocean pH in 1850

Compared with preindustrial levels shown here, the projected increase in ocean acidity is about 170% by 2100 if high CO2 emissions continue (RCP* 8.5).

Atmospheric CO2 and ocean pH

Observations of CO2 (parts per million) in the atmosphere and pH of surface seawater from Mauna Loa and Hawaii Ocean Time-series (HOT) Station Aloha, Hawaii, North Pacific.
Credit: Adapted from Richard Feely (NOAA), Pieter Tans, NOAA/ESRL (www.esrl.noaa.gov/gmd/ccgg/trends) and Ralph Keeling, Scripps Institution of Oceanography (scrippsco2.ucsd.edu)
Observed CO2 emissions and emissions scenarios to 2100

Global CO2 emissions (white dots, uncertainty in grey) from fossil fuel use is following the high emissions trajectory (red line, RCP* 8.5) predicted to lead to a significantly warmer world. Large and sustained emissions reductions (blue line, RCP* 2.6) are required to increase the likelihood of remaining within the internationally agreed policy target of 2°C.
Credit: Glen Peters and Robbie Andrew (CICERO) and the Global Carbon Project, adapted from Peters et al., 2013 (reference 8). Historic data from Carbon Dioxide Information Analysis Center.
Ocean surface pH projections to 2100

Modelled global sea-surface pH from 1870 to 2100. The blue line reflects estimated pH change resulting from very low CO2 emissions to the atmosphere (IPCC Representative Concentration Pathway, RCP* 2.6). The red line reflects pH from high CO2 emissions (the current emissions trajectory, RCP* 8.5).
Credit: Adapted from Bopp et al., 2013 (reference 9).
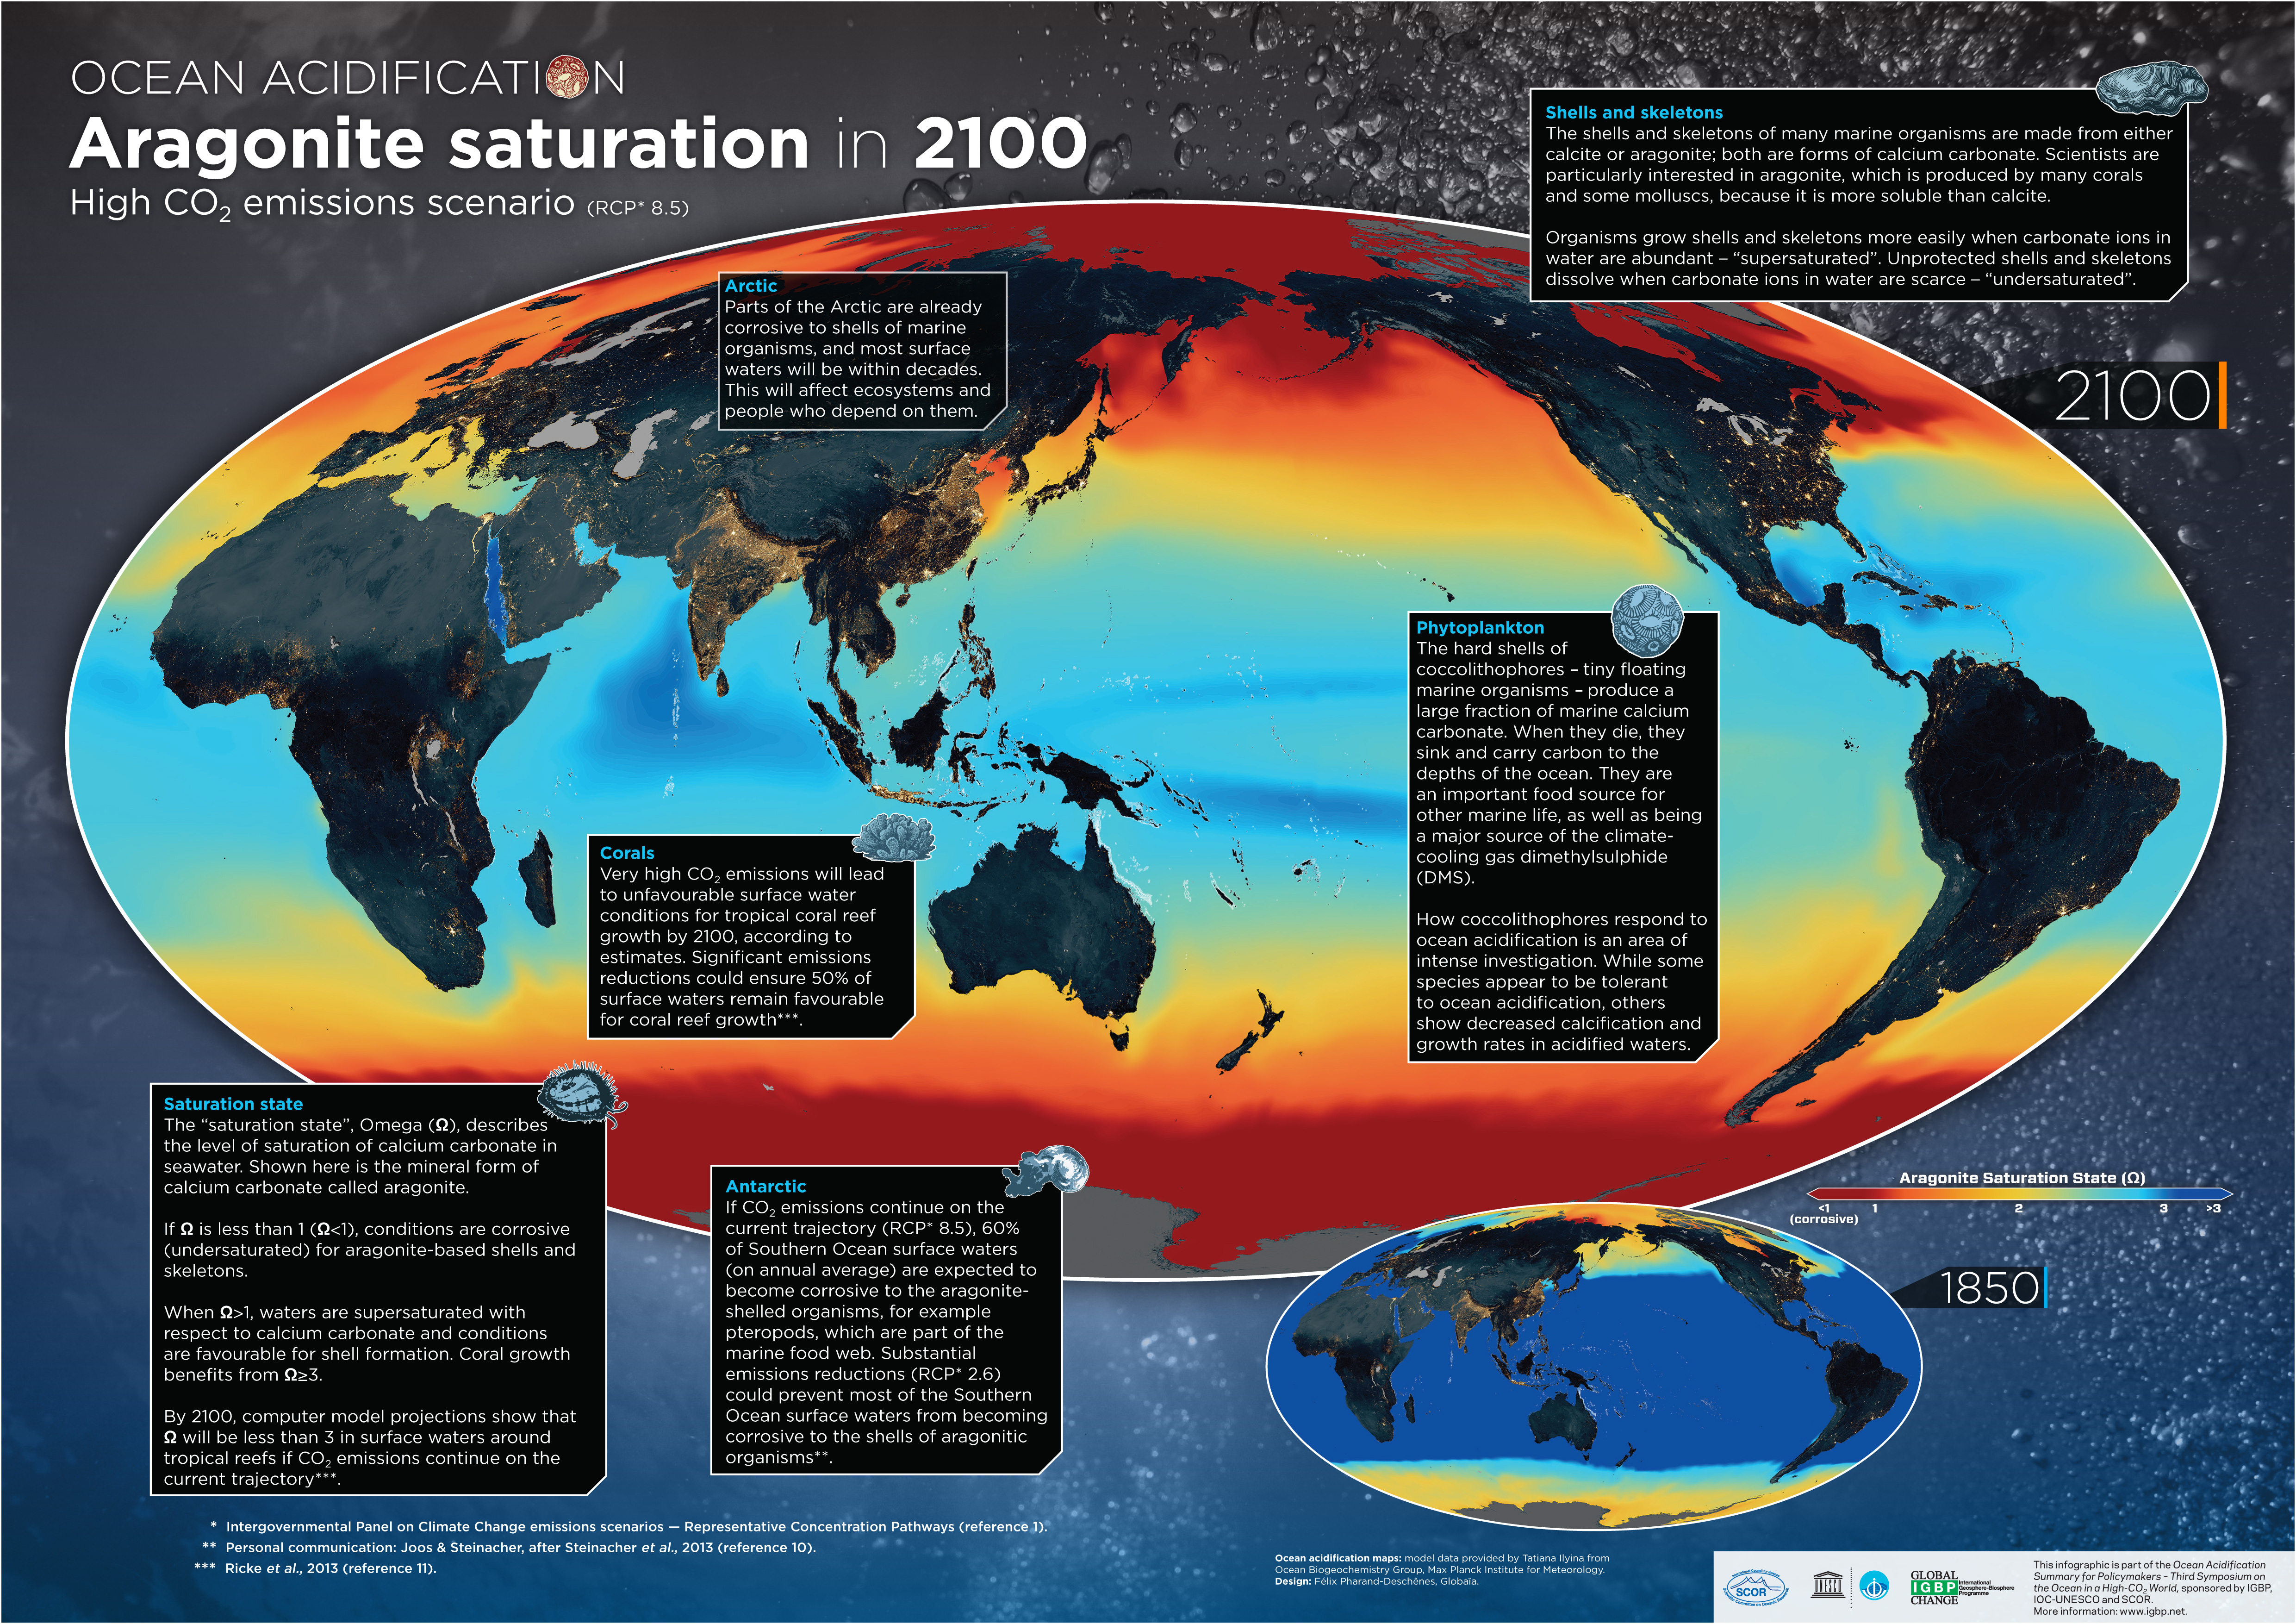
Aragonite saturation in 2100
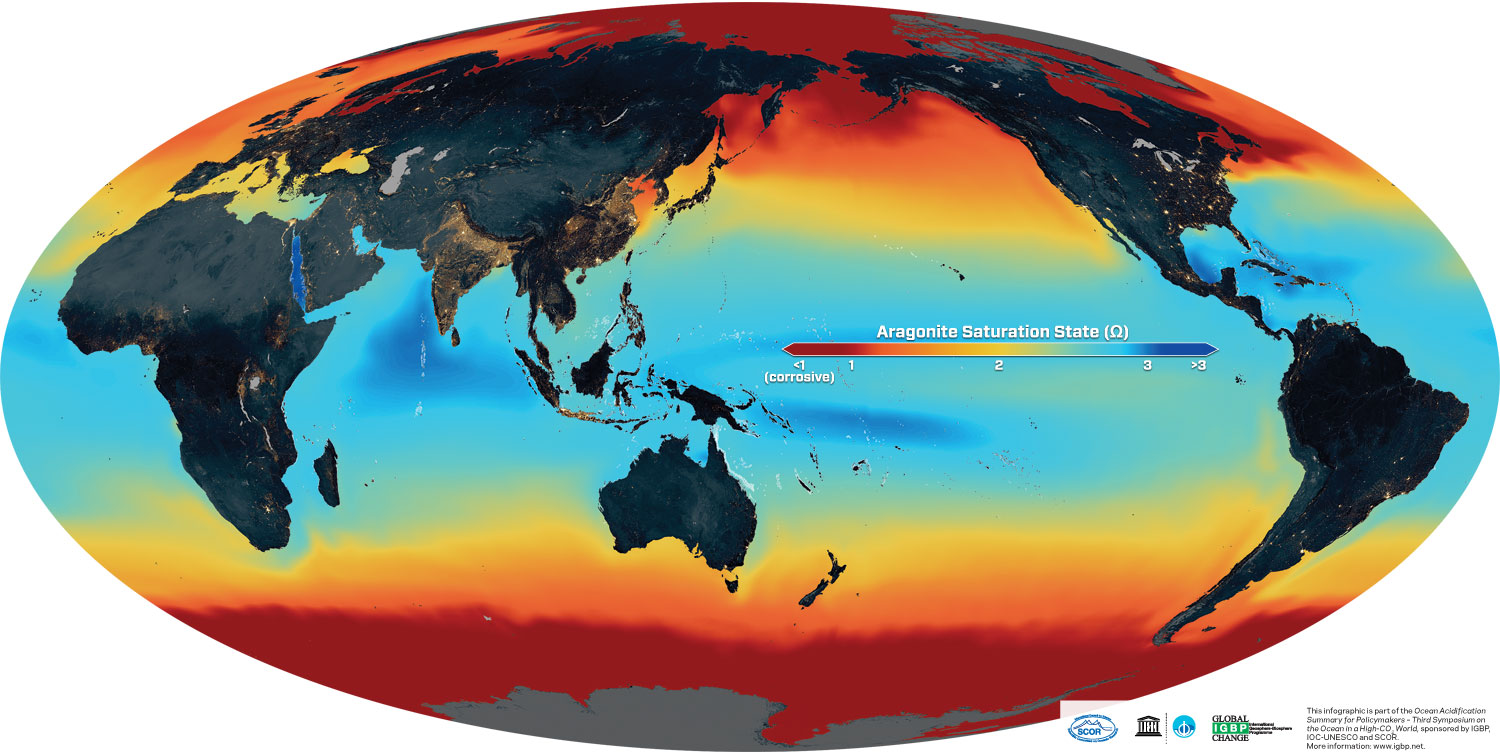
This map shows the “saturation state” for the mineral form of calcium carbonate called aragonite.
If Ω is less than 1 (Ω<1), conditions are corrosive (undersaturated) for aragonite-based shells and skeletons. Coral growth benefits from Ω≥3.
By 2100, computer model projections show that Ω will be less than 3 in surface waters around tropical reefs if CO2 emissions continue on the current trajectory.
Aragonite saturation 1850-1860

Aragonite saturation for surface ocean waters, at the beginning of the industrial revolution.


IGBP closed at the end of 2015. This website is no longer updated.
-

Global Change Magazine No. 84
This final issue of the magazine takes stock of IGBP’s scientific and institutional accomplishments as well as its contributions to policy and capacity building. It features interviews of several past...
-

Global Change Magazine No. 83
This issue features a special section on carbon. You can read about peak greenhouse-gas emissions in China, the mitigation of black carbon emissions and the effect of the 2010-2011 La Niña event on gl...
-
INTERGOVERNMENTAL PANEL ON CLIMATE CHANGE:
How green is my future?
UN panel foresees big growth in renewable energy, but policies will dictate just how big.
-
UK:
'The Anthropocene: a new epoch of geological time?'
Royal Society, Philosphical Transactions A