


| SEARCH |
-

Nov 17, 2015
Reflections on a three-decade legacy
The International Geosphere-Biosphere Programme (IGBP) will come to a close at t...
-
Nov 17, 2015
Use of and access to content on this website
Text and images produced by IGBP in house are free to use with appropriate credi...
-
Nov 12, 2015
Bella Gaia performance and panel discussion to mark IGBP's closure
A musical performance by Bella Gaia will celebrate the achievements and legacy o...
-

Towards Future Earth:
evolution or revolution?
During its three decades of existence, the International Geosphere-Biosphere Pro...
-
A personal note on IGBP and the social sciences
Humans are an integral component of the Earth system as conceptualised by IGBP. João Morais recalls key milestones in IGBP’s engagement with the social sciences and offers some words of advice for Future Earth.
-
IGBP and Earth observation:
a co-evolution
The iconic images of Earth beamed back by the earliest spacecraft helped to galvanise interest in our planet’s environment. The subsequent evolution and development of satellites for Earth observation has been intricately linked with that of IGBP and other global-change research programmes, write Jack Kaye and Cat Downy .
-
Deltas at risk
Around 500 million people worldwide live on deltas, but many of the world's deltas are sinking due ...
-
Climate change: the state of the science
A new data visualization released on the first day of the plenary negotiations at the UNFCCC’s clima...
-
Climate Change:
the State of the Science
Videos now online from the Stockholm public forum to mark the launch of the IPCC's climate report, 2...

photos: US National Ice Core Laboratory; © iStockphoto.com/Joshua Haviv;
Claire Desjardins; Sandramo
First published in IGBP's Global Change magazine Issue 81, October 2013
A Regional View of Global Climate Change
New landmark research shows how climate has changed over the last two millennia by continental region and compared to the global average. Darrell Kaufman, Nicholas McKay, Thorsten Kiefer and Lucien von Gunten of the PAGES 2k Consortium explain the differences and commonalities, through reconstructions of temperature histories from around the world.
Darrell Kaufman is a Regents’ professor in the School of Earth Sciences and Environmental Sustainability at Northern Arizona University (US) and was lead author of the PAGES 2k Consortium synthesis paper.
Nicholas McKay is an assistant research professor at the School of Earth Sciences and Environmental Sustainability at Northern Arizona University (US).
Thorsten Kiefer is the executive director of IGBPʼs Past Global Changes (PAGES) project, in Bern (Switzerland).
Lucien von Gunten is science officer of PAGES and coordinates the PAGES 2k Network.
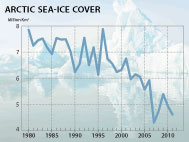
In the year 1258 common era (CE), explosive eruptions from one or more unidentified volcanoes injected a vast amount of dust and acidified steam high into the atmosphere. The veil of particles impeded the Sun’s rays for years, triggering the expansion of Arctic sea ice and leading to further cooling in the Arctic.
Lakes froze harder and longer in the Arctic during the 1260s, when temperatures dipped about 0.3°C lower than the average temperature of the last millennium. Algal production diminished in the lakes.
Meanwhile, halfway around the world in South America, trees thrived as growing-season temperatures increased by 0.3°C compared with the long-term average. At the same time, offshore of Australia, corals experienced higher surface ocean temperatures, a similar warming story recorded in their calcium carbonate layers.
On average, the planet was cooling at the time. But here were regions on the Earth experiencing that global average in opposite ways.
Climate scientists tend to talk about a warming planet: the average global temperature is on the rise, as greenhouse gas emissions swiftly heat up the Earth’s atmosphere. But it turns out that different regions on Earth respond differently, perhaps lagging or speeding ahead, depending on where they are situated relative to global-change–driven shifts in atmospheric circulation and ocean currents. A new view of regional temperature records over the past two millennia illustrates just how each continent has varied along with past global climate changes.
Complex feedbacks
Put simply, Earth’s climate is determined by the amount of incoming and outgoing radiation. But the details get complex: long-term cycles in the Earth’s orbit, fluctuations in the Sun’s output, and changes in the concentration of greenhouse gases and aerosols all influence the Earth’s energy balance globally. However, these global-scale changes do not translate uniformly around the Earth; the atmosphere, oceans, and other components of the climate system redistribute energy in complex ways. The cause of global climate change might be geographically uniform, but its response is jumbled.
Climate scientists want to better understand how changes to the global energy balance, such as a changing greenhouse effect, are manifested in climate changes at regional scales, where they actually matter to people. A better understanding of the underlying processes will be important as we prepare for the plausible range of future changes from a combination of anthropogenic and natural drivers. The only way to investigate processes that operate over centuries or longer is to reconstruct past climate variability over space and time.
We know the most about recent climate changes, documented after the advent of precise instruments that track temperature, precipitation and more. But climate also varies naturally on long time scales, and going a century or more back in time quickly moves beyond the instrumental record. Fortunately, natural archives and historical documents offer indirect evidence, or proxies, of past climate variability; palaeoclimate researchers can tap those records to extract information about past climate changes.


Figure 1. The regional PAGES 2k temperature reconstructions are based on the proxy record sites and types mapped here (with the exception of those from Africa, where there were too few sufficiently good temperature records).
PAGES 2k Network
In 2006, IGBP’s Past Global Changes project (PAGES) began to set up the 2k Network, with the goal of compiling and analysing a global array of regional climate reconstructions for the last 2000 years. The network focused on the last two millennia because a sufficient number of proxy data records cover that timeframe in many regions; plus, fundamental features of the climate system, like the amount of glacier ice on Earth and sea levels, were similar to those of recent conditions, simplifying the interpretation of long-term climate changes.
The PAGES 2k Consortium is composed of 78 regional experts from 24 countries, representing 8 continental-scale regions. These experts culled through the proxy records available from individual sites, identifying which were best suited specifically for reconstructing temperature variability within their region (Figure 1). The resulting PAGES 2k dataset includes 511 individual time series from various archives. Most of the information comes from the analysis of tree rings, and the rest from ice sheets and glaciers, speleothems, corals, pollen, sediments from lake and ocean bottoms, and historical documents.
Each of these archives records temperature in different ways, many by individual years. The analytical methods for reconstructing past temperature from physical or biological properties are well established. For example, mud accumulates at the bottom of lakes, trapping the remains of algae and insects. Temperature changes affect the precise chemical make-up of the algal cell walls or the dominant species type of larval midges, providing a record that can be interpreted in terms of past temperature changes.
From these archives, the PAGES 2k Consortium reported the most comprehensive evaluation to date of temperature change at the surface of Earth’s continents, over the past one to two millennia. The result is the first major synthesis product of the PAGES 2k Network, published last May (Nature Geoscience, doi:10.1038/ngeo1797).
Previous studies have focused on temperature reconstructions over the Northern Hemisphere, or they considered the planet as a whole. These perspectives are useful for understanding overall average conditions, but not for recognising important differences at the regional scale. In particular, the new synthesis includes temperature reconstructions from Antarctica, Australasia and South America, which clarify the poorly documented temperature history for Southern Hemisphere continents.
Millennial-scale cooling
The most coherent feature in nearly all of the regional temperature reconstructions is a long-term cooling trend, which ended late in the 19th century. The cooling was slow – between about 0.1 and 0.3°C over 1000 years – but detectable in the PAGES 2k proxy climate datasets. A preliminary analysis using a climate model indicates that the overall cooling was caused by a combination of factors, including a decrease in solar irradiance and an increase in volcanic activity, as well as changes in land cover and slow changes in the Earth’s orbit. The climate-model simulations also suggest that each factor was more or less important in different regions.
A recent reconstruction of average global temperature stretches further back, over the past 11,300 years (Marcott et al. 2013). These researchers focused mostly on proxy records from marine sediments, which usually have a resolution at the scale of centuries. That study’s data thus are based on a very different foundation from that of PAGES 2k, but one that places the PAGES 2k reconstruction independently in the context of even longer-term trends (Figure 2). When averaged among the continental-scale regions, the cooling trend prior to the 20th century detected in the PAGES 2k study agrees with Marcott and his colleagues’ longer-term record.
Figure 2: The average of all seven PAGES 2k regional relative temperature reconstructions (aqua; see Figure 3) compared to the recently published global temperature reconstruction that extends back 11,300 years (brown). Annual global temperatures from the HadCRUT4 instrumental dataset are shown for reference, as a time series (red). A star marks the average temperature of the most recent 30-year period (1983–2012).
Regional variability
The long-term cooling trend casts new light on the classical view of a Medieval Warm Period followed by a colder Little Ice Age. Scientists have had a hard time pinning down the onset and end of these two intervals with any consistency: they seemed to have occurred at different times in different places. The PAGES 2k mapping of temperature changes across the globe delivered proof that temperatures did not fluctuate uniformly among all regions (Figure 3).
At longer multi-centennial scales, all regions were generally warmer earlier and then cooled, but there were no globally synchronous multi-decadal warm or cold intervals that define a worldwide Medieval Warm Period or Little Ice Age. Instead, the specific timing of peak warm and cold intervals varied regionally, with multi-decadal variability resulting in regionally specific temperature departures from an underlying global cooling trend.
The temperature fluctuations during the last one to two millennia were more uniform within the hemispheres than between them. In the Northern Hemisphere, the period from around 850 to 1100 CE generally was warmer. In contrast, in South America and Australasia, a sustained warm period occurred later, from around 1160 to 1370 CE. Similarly, the transition to colder regional climates between 1200 and 1500 CE is evident earlier in the Arctic, Europe and Asia than in North America or the Southern Hemisphere.

Figure 3: Temperature changes in the seven PAGES 2k continental-scale regions, arranged in rows from north to south. Colours indicate the relative extent to which temperatures were warmer (red) or cooler (blue) than the average from 1200–1965, the period of overlap for the seven reconstructions. The most prominent feature of nearly all of the regional temperature reconstructions is the long-term cooling that ended late in the 19th century. On shorter time scales (decades to centuries), temperatures did not fluctuate uniformly among all regions.

Recent warmth
The 20th century ranked as the warmest in all regions except Antarctica. During the last 30-year period in the PAGES 2k reconstructions (from 1971 to 2000), the average reconstructed temperature of all of the regions was likely the warmest in nearly 1400 years. However, temperatures in some regions were higher in the past than they were during the late 20th century. The longer the individual site record, the more likely it would show prior warm intervals, which is expected for an overall cooling trend such as found in the PAGES 2k reconstructions, and in the longer 11,300-year reconstruction. In Europe, for example, the average temperature between 21 and 80 CE (two millennia ago) was warmer than during 1971 to 2000.
But these localised warm periods of the past do not suggest that the recent average global warming of the past few decades is part of a natural cycle. Figuring out whether the temperature change is unprecedented (which it is not entirely) is not the same as determining whether it is influenced by humans (which it almost certainly is).
The increase in average temperature for all of the PAGES 2k regions between the 19th and 20th centuries exceeded the temperature difference between all other consecutive centuries in most regions (note the pronounced blue-to-red shift towards the right in Figure 3). The global warming that occurred in the 20th century reversed a long-term global cooling trend. This pre-industrial cooling trend was likely caused by natural factors that continued to operate through the 20th century, making the 20th century warming difficult to explain without the impact of increased greenhouse gases from anthropogenic emissions.
Regional shifts in global trends
Like the atmosphere that envelops our planet, Earth’s climate is a global system, but it’s the smaller-scale features of climate that most directly influence human and ecological systems. Understanding how changing climate affects a particular region requires both a global view of the climate system and the collective local knowledge of collaborating scientists from around the world.
The PAGES 2k reconstructions have shown clear regional expressions of temperature variability at the multi-decadal to century scale, whereas a long-term cooling trend prior to the 20th century is evident globally, as a backdrop to these regional pictures. These findings point to the necessity of understanding local differences for a truly global view, and the next steps of PAGES 2k will be to refine the temperature reconstructions and add a history of regional precipitation changes. The data assembled for this first synthesis are available for downloading through the NOAA Paleoclimatology World Data Center, and will no doubt be analysed for years to come, using alternative approaches to reveal other patterns and address further research questions through the PAGES 2k Network and beyond.
The PAGES 2k CONSORTIUM represents 78 scientists of the PAGES 2k Network who made an active contribution to the temperature history paper in Nature Geoscience. PAGES is sponsored by the US National Science Foundation, US National Oceanographic and Atmospheric Administration and Swiss National Science Foundation.
Further Reading
Marcott S A et al. (2013) Science 339: 1198, doi:10.1126/science.1228026
PAGES 2k Consortium (2013) Nature Geoscience 6:339–346, doi:10.1038/ngeo1797
http://www.realclimate.org/index.php/archives/2013/04/the-pages-2k-synthesis/


IGBP closed at the end of 2015. This website is no longer updated.
-

Global Change Magazine No. 84
This final issue of the magazine takes stock of IGBP’s scientific and institutional accomplishments as well as its contributions to policy and capacity building. It features interviews of several past...
-

Global Change Magazine No. 83
This issue features a special section on carbon. You can read about peak greenhouse-gas emissions in China, the mitigation of black carbon emissions and the effect of the 2010-2011 La Niña event on gl...
-
INTERGOVERNMENTAL PANEL ON CLIMATE CHANGE:
How green is my future?
UN panel foresees big growth in renewable energy, but policies will dictate just how big.
-
UK:
'The Anthropocene: a new epoch of geological time?'
Royal Society, Philosphical Transactions A